Surveying with smart phone GNSS
We purchased a vacant lot recently, and we are planning to take on the grand challenge of designing and building our own home. To get started with the planning, we needed to carry out some approximate surveying. The lot is quite large, but there are some factors that heavily affect the future layout of the property. Most notable factor is a steep, large rock that takes up a good portion of the lot. To map out the approximate shape of the rock for layout planning, I decided to go full DIY mode and carry out the surveying with an Android smart phone GNSS receiver.
Measurement setup
I dug up an old smart phone of mine, a Moto G5, and installed the NMEA Tools app on it. This a handy app that allows you to log the NMEA sentences from the phone’s GNSS receiver into a text file. The free version allows you to record approximately 15 minutes at a time. I mounted the phone on a tripod, and started recording the outline of the rock. I collected over 10 minutes of data for every point. The long recording period was important, as the trees surrounding the rock disturbed the GNSS positioning quite a lot. From the collected NMEA data, I averaged the longitude and latitude. Using the property corner marker as reference, I transformed the geodetic coordinates to East, North, Up-coordinates.
Results
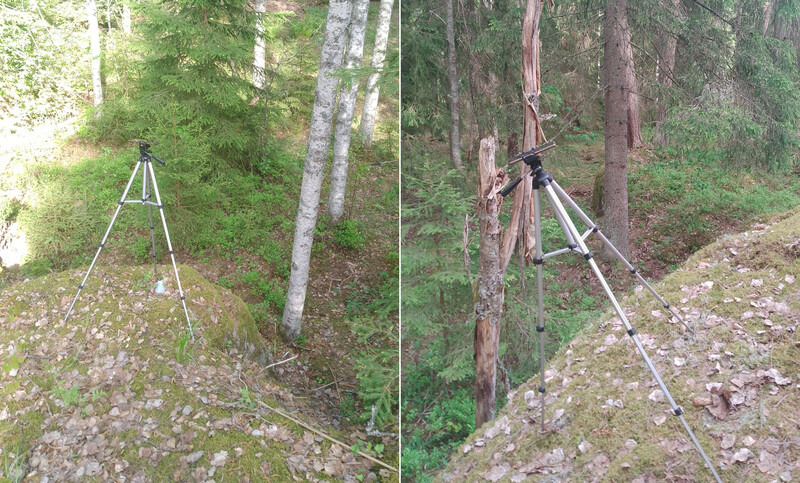
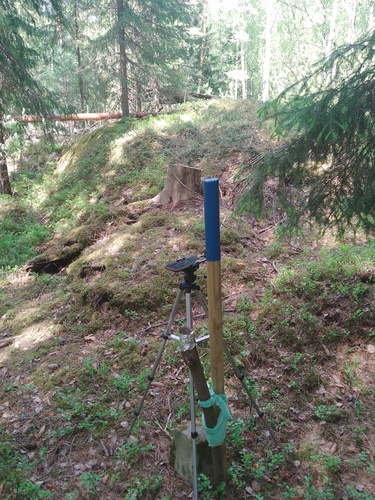
Qualitatively assessing the results, the GNSS positions seemed to quite well capture the outline of the rock. However, qualitative assessment is not enough for an engineer. The corner marker of the property provided a solid ground truth for detailed analysis of error in the GNSS positioning. So, I carried out a reference measurement on the corner marker, again recording data for over 10 minutes. You can see the measurement setup below.
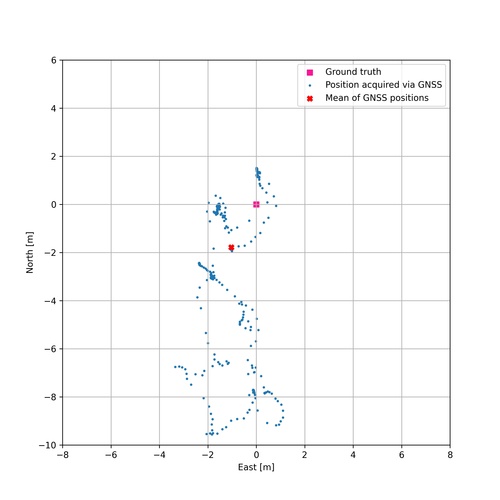
Below I’ve plotted the acquired GNSS position measurements, the mean of the measurements, as well as the ground truth (corner marker location). The distance between the measurement mean and the ground truth was 2.1 metres. This is surprisingly good, considering that a cheap GNSS receiver was used without any kind of corrections (differential, real-time kinematic, etc.). The measurement environment was highly difficult for GNSS positioning, considering the surrounding trees limited the visibility of the sky. Couple metres of error is sufficient for these rough measurements, as the property has an area of roughly 5000 square metres.
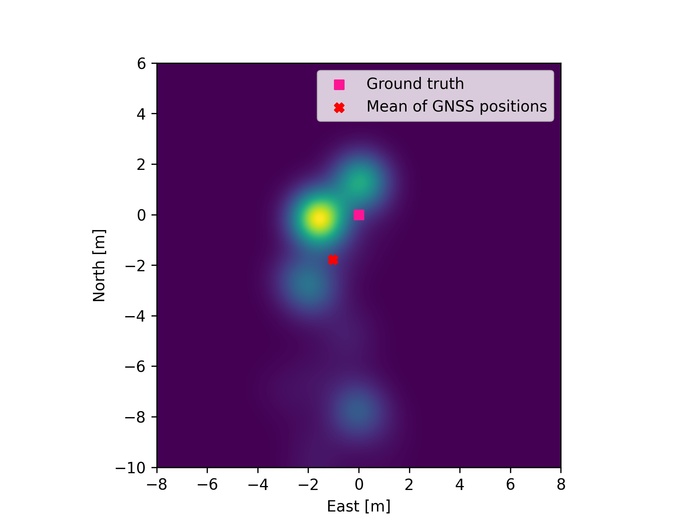
Taking the mean of the measurements was not exactly the optimal approach according to this reference measurement, as the outlier measurements 6-10 metres to the south are skewing the mean. This is especially visible when the results are turned into a heatmap. Below is presented a heatmap which has been filtered with a 2D gaussian filter. There are two clear hotspots next to the ground truth. Proper filtering algorithms, such as some sort of bayesian smoothing or RANSAC, could have possibly more accurately captured the underlying real position from the noisy data. However, benchmarking different filtering algorithms based on just this one measurement would not likely have provided a realistic result. A simple mean is a fairly robust approach, without detailed assumptions of the noise distribution.